We want to turn our attention to recent economic developments as conditions in the US continue to worsen. The M&A market is not immune to these worsening conditions. There is a lot to cover on this issue, so this topic will span over several articles. Today, we’d like to focus on macroeconomic indicators that are troublesome.
US Inflation at 40-Year Highs
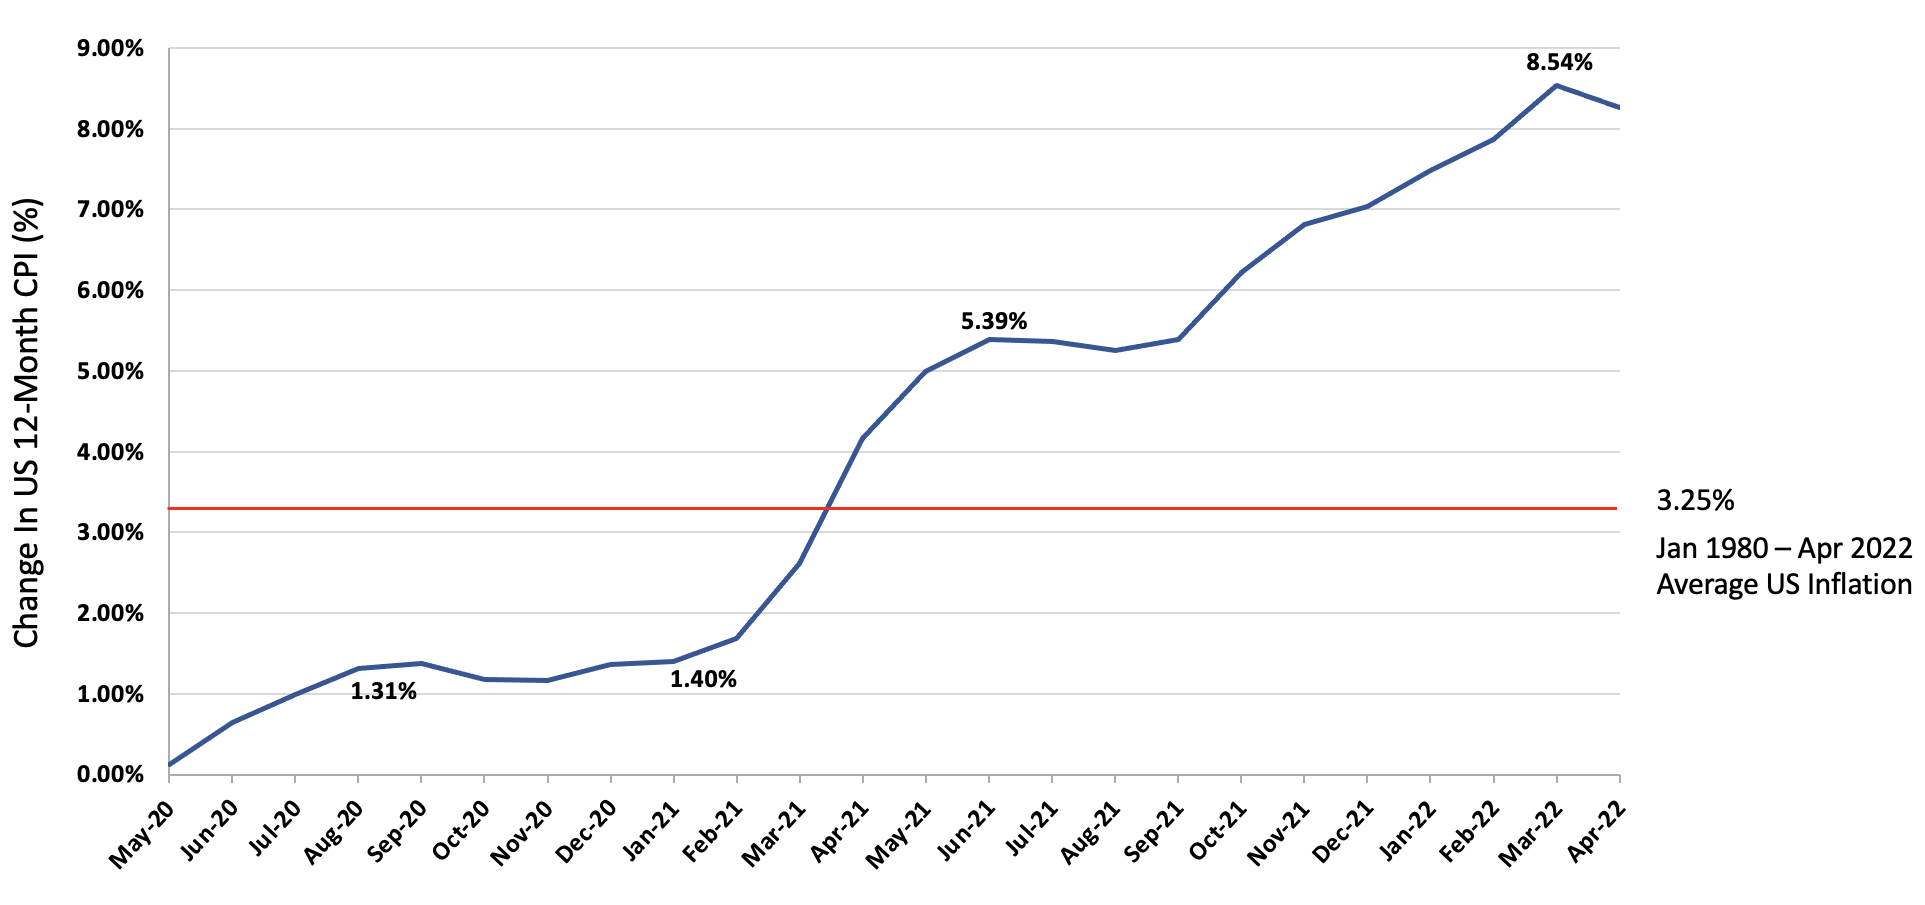
While nominal wage growth was reported to be 5.46% in April, inflation was 8.3%. Bottom line, the American worker’s wage increases are overshadowed by even higher inflation. According to Rick Santelli from CNBC, “Prices are hitting 40-year highs, and they are not going back.” The government’s $5Tn injection of cash into the money supply since the pandemic began, combined with excessive stimulus packages, has stoked inflation. This is evidenced by inflation’s rise since 2021 began.
Inflation Grew from 1.3% to 8.5% over 19-Month Period
Source: Multpl.com
What is troublesome is that…
- If the CPI were to be computed in the same way as 40 years ago, the rate would be much higher than 8.3%. In fact, Shadow Government Statistics employs a pre-1990 based, alternative CPI model to estimate the current inflation, applying CPI calculation methods used in the 80s. Using this methodology, analysts have estimated current inflation to be around 17.15%, which is higher than the 1981s super high 14.6% rate!
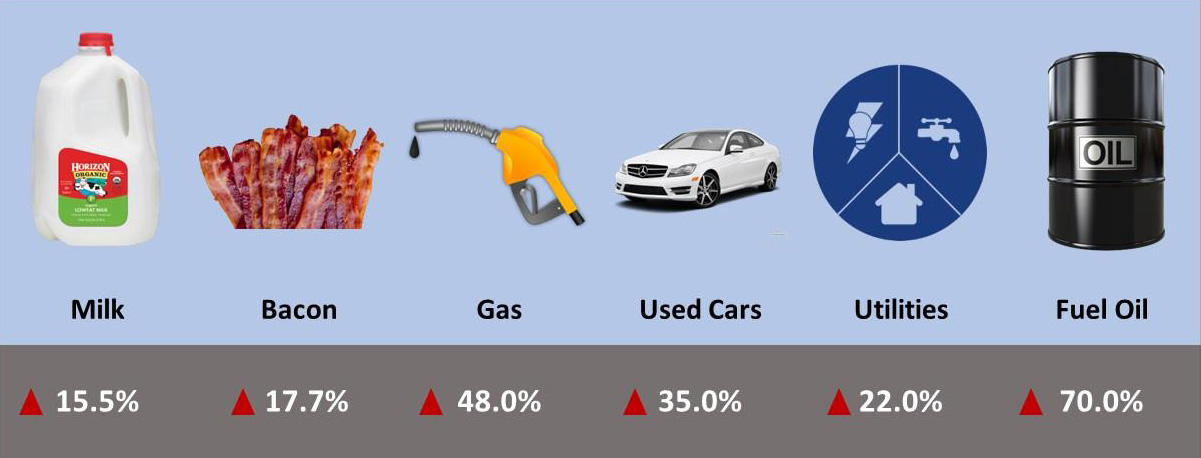
- There is widespread misperception that inflation in 2022 is a global issue, but that is in fact not true. To give a few examples, China, Japan and Switzerland all have year-over-year CPI of less than 3%. Taiwan, South Korea and France all have CPI less than 5%. Australia, Norway, Finland and Italy all have CPI less than 6%. Inflation is making Americans disproportionately poorer than many other countries. At the same time, US consumers are experiencing dramatic and worrisome price increases of consumer goods.
Inflation’s Tax on Consumer Goods (Year over Year Ending March-April 2022)
 Source: Fox News
Consumer Sentiment Also at Lows
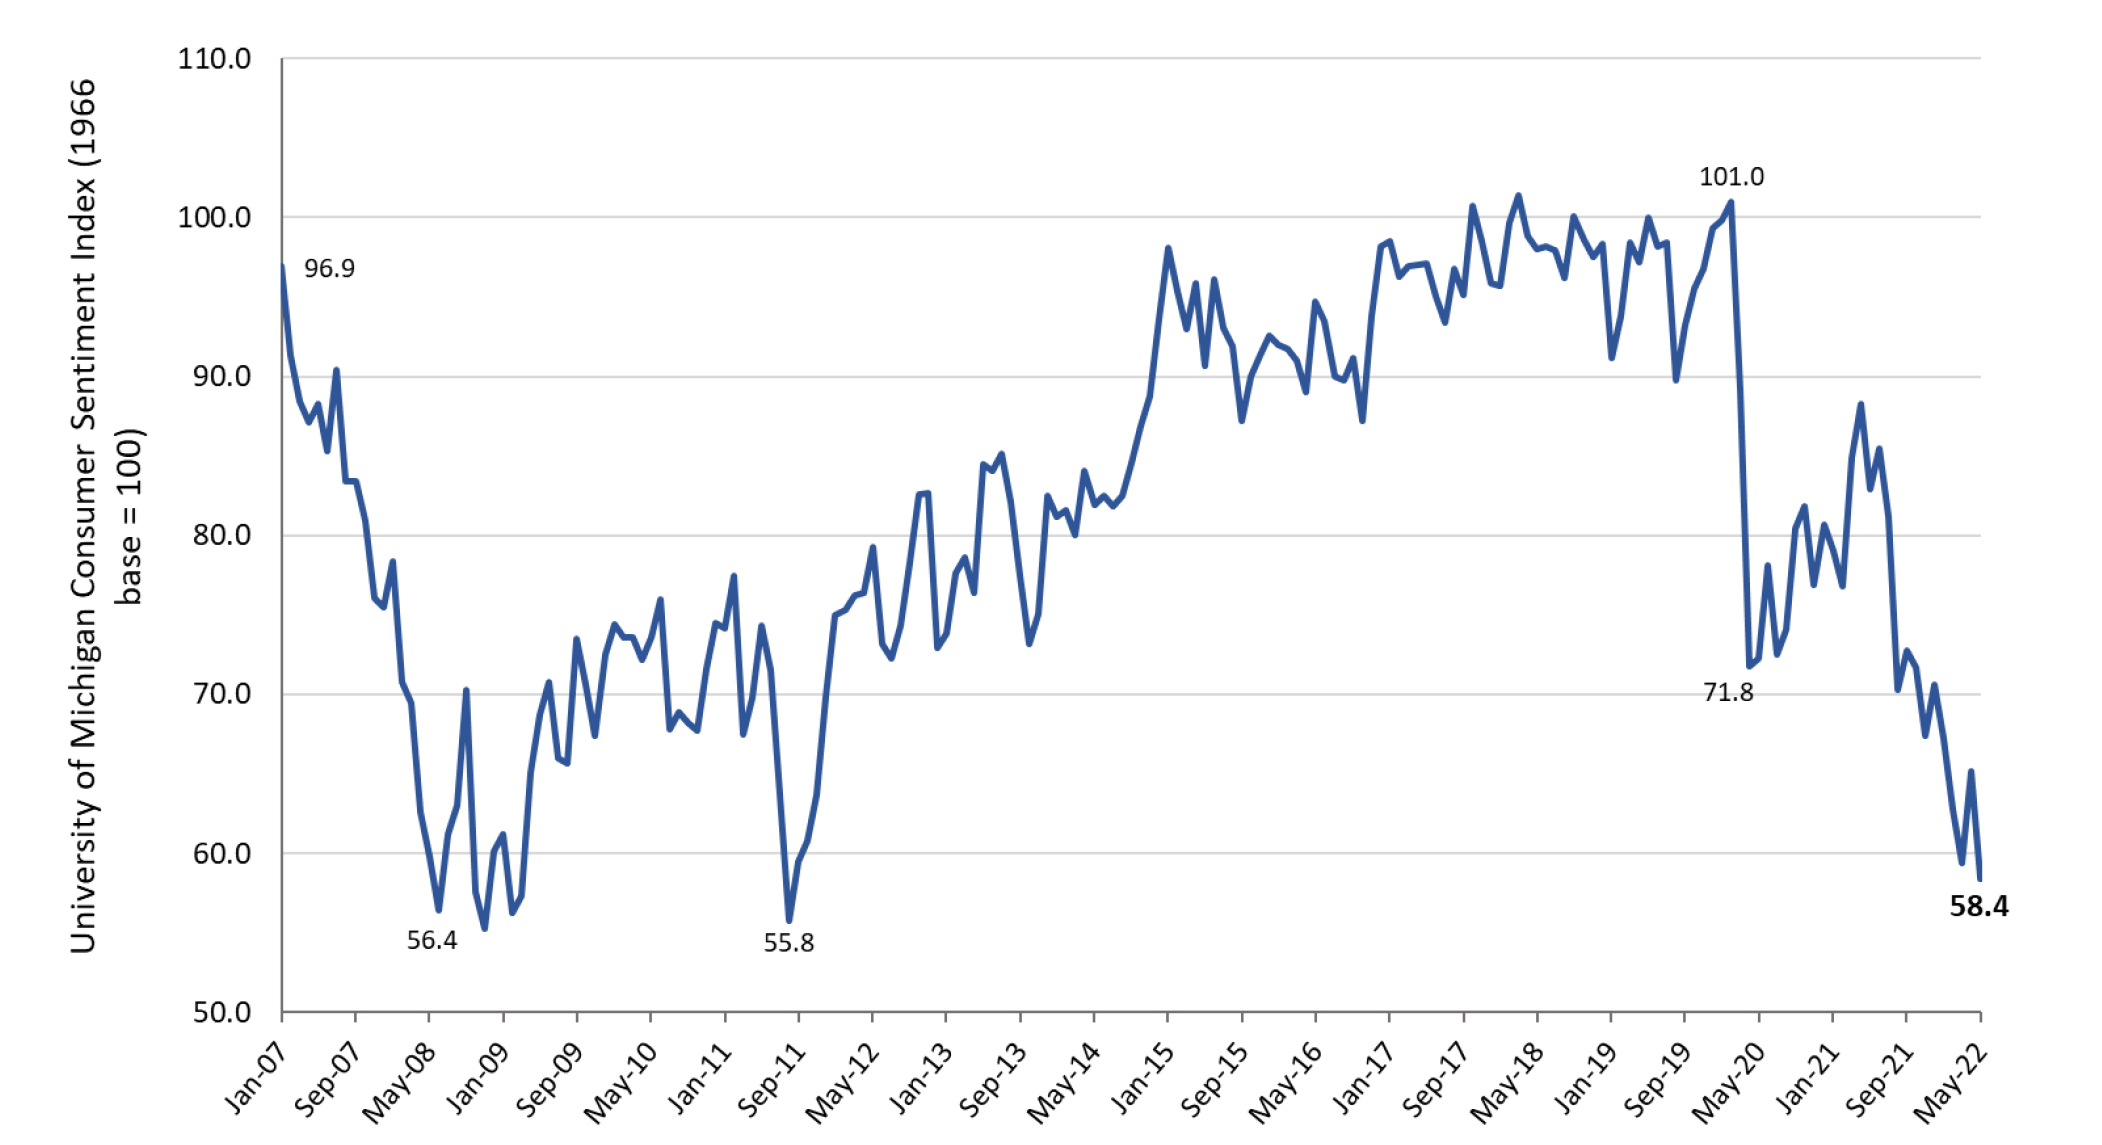
In May, the University of Michigan Consumer Sentiment fell to 58.4, a low not seen since August 2011, when it dropped to 55.8. For reference, the lowest point of the University of Michigan Sentiment was in May 1980, at 51.7, as the country struggled with stagflation. This index measures three different aspects of the consumer outlook on the economy: how consumers view prospects for their own financial situation, how they view prospects for the general economy over the near term, and their view of prospects for the economy over the long term. As the chart below indicates, overall consumer confidence in the current condition of the economy has been on a steep decline as inflation looms over US consumers.
Consumer Confidence is Plummeting, Signaling Recession
 Source: Federal Reserve Economic Data
Rare Scenario that the Stock & Bond Markets Decline Simultaneously
As I write this article, the S&P has fallen into bear market territory, technically defined as a peak to trough decline in value of 20% or more. Additionally, year-to-date, the NASDAQ is down 26% while the DOW is down 14%. What is unusual here in 2022 is that typically when the stock market dips into a bear market, there is a flight to safety into the bond market. That is not happening, however. Instead, the bond market has been plummeting, too, causing investors to pull out of financial markets entirely and move into tangible assets. Returns across all fixed income indices are negative (municipal bonds, high yield, treasuries, corporates, mortgage-backed, asset-backed, emerging markets).
Spiking Energy Prices Will Deepen Recessionary Period
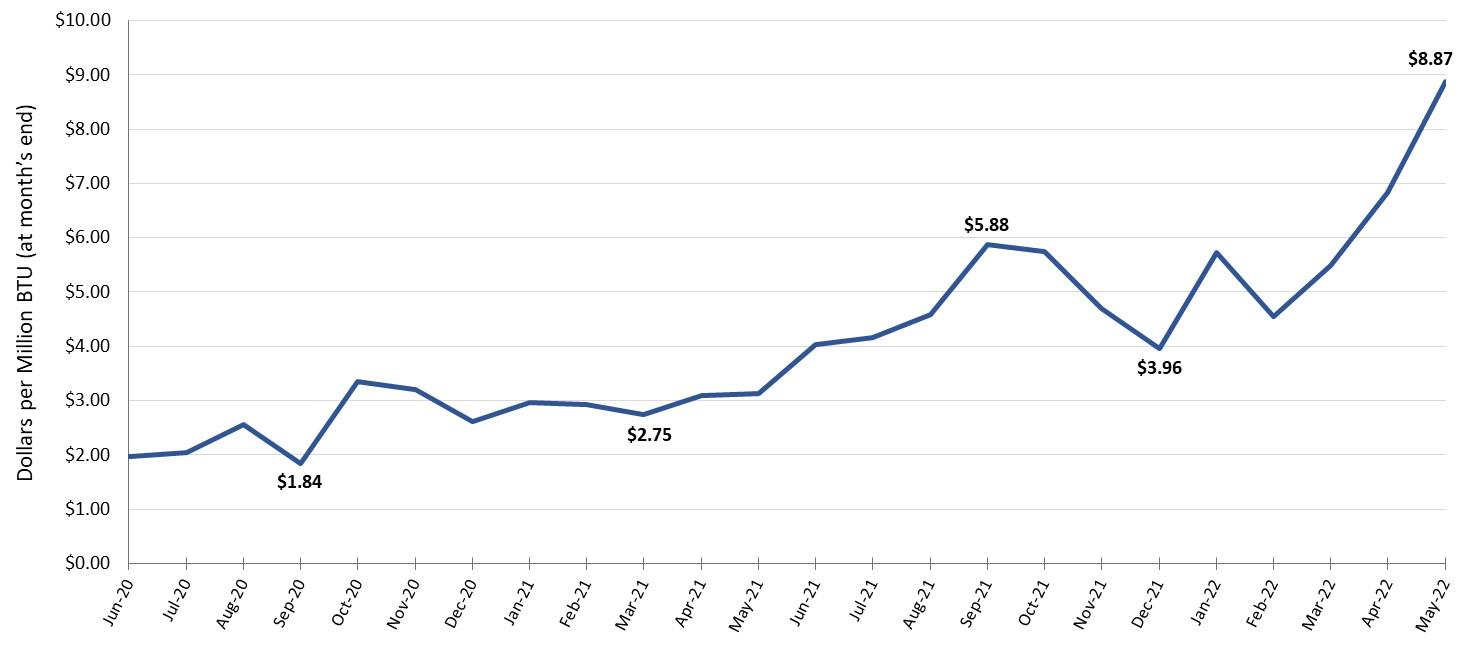
Several analysts are predicting a nationwide average of $6 a gallon gasoline price at the pump by August. Average Diesel Fuel for the week of 5/16/22 was $5.61, up from $2.36 from just 1 year ago, a 72.6% increase! Further, natural gas has risen from $2.55 in August of 2020 to a staggering $8.87 per unit on May 24th, which has a significant, negative impact on our manufacturing sector, as it is heavily powered by natural gas. Unsustainable energy prices, whether they be gasoline, diesel, or natural gas, drive all goods and service prices higher. Pictured in the chart below, the per-unit price of natural gas has been on a steep upward trajectory which has historically proven to be an indication of economic turmoil.
Increasing Natural Gas Prices are Hurting US Manufacturers
 Source: Macrotrends
The Fed’s Difficulty in Achieving a Soft Landing
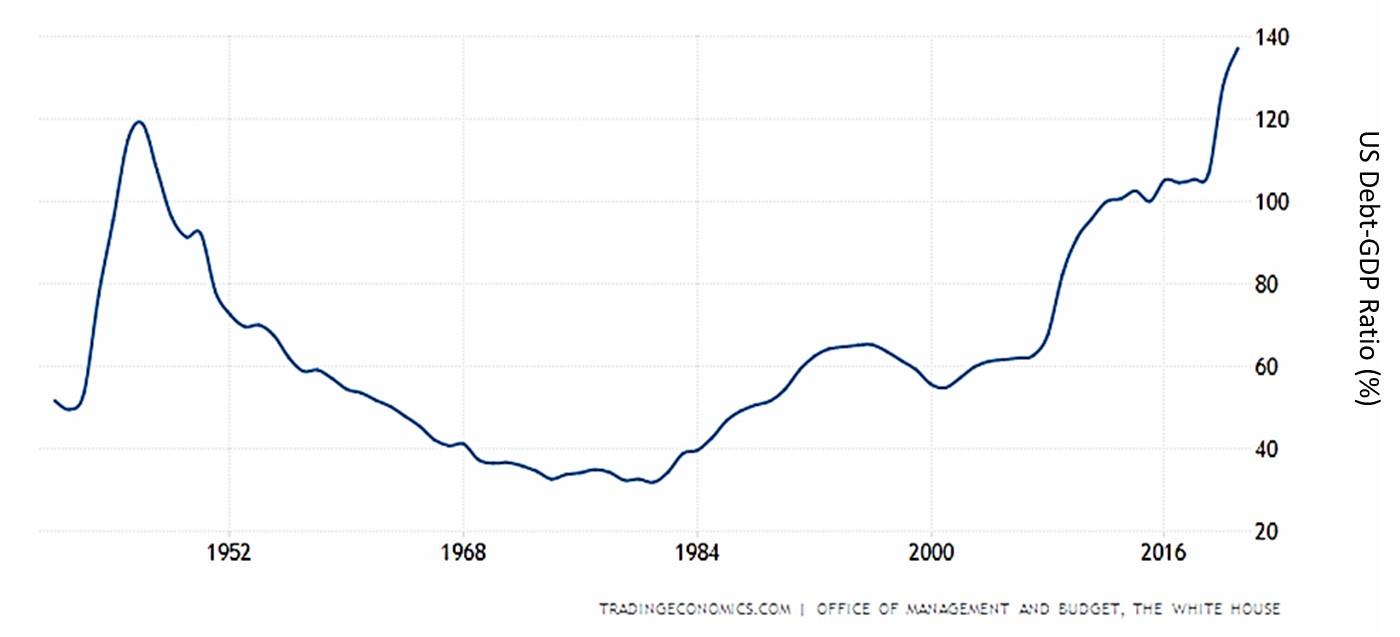
So far in 2022, the Fed has raised the fed funds rate 75 basis points (bp) to 1% from 25 bp in efforts to throw water on raging inflation. There is a great deal of debate and criticism as to the Fed’s unlikelihood of being able to achieve a soft landing to squelch inflation, while avoiding crashing economic growth. Many believe signs point to a season of stagflation, a cycle not seen since the late 1970s, where a stagnant economy meets high inflation. To make matters worse, the US unfortunately does not have the balance sheet that we had in the 1970s. In 1976, our national debt stood at $620 billion. By 2000, it had grown to $5.67 trillion. Here in 2022, it has reached over $30 trillion. The US has the largest national debt of any country worldwide. The chart below shows the US Debt-GDP Ratio (%) climbing to a historic high of 137% which surpasses post-WWII levels. This alarming figure is also higher than the Debt-GDP ratio the US economy experienced during the Civil War, WWI, and the Great Depression. This is not a worldwide trend as the US currently has the third worst Debt-GDP ratio of all of the countries in the G20.
Debt-GDP Ratio (%) Reaches Highest in US History
 Expecting a period of stagflation with $30 trillion in national debt is concerning. How would such a period impact the M&A markets? Stay tuned for future Wires in the upcoming weeks, where we consider the implications of economic woes on the M&A markets.
